

Please note: Our 2023 Pay Gap data is presented on these pages; additional supporting information continues to be updated.
There is no statutory duty to analyse or report on ethnicity pay, but in line with our commitments to advancing racial equality the University has committed to do so. Our Ethnicity Pay Gap analysis follows the same methodology as is required for statutory reporting of the Gender Pay Gap, including the calculation of median and mean gaps, and quartiles. Employees who have declined to disclose their ethnicity, or whose ethnicity is unknown are excluded from the analysis (including headcounts).
The University recognises the limitations of using only Black, Asian or Minority Ethnic (BAME) as a way of grouping colleagues and therefore provides data on both two and five groups of ethnicity.
Two groups is reported as the difference between White staff and staff from a Black, Asian, or Minority Ethnic (BAME) background. A breakdown of this data is available in dashboard D.
five groups is reported as the difference between White staff and staff from either a Black, Asian, Mixed or other background. A breakdown of this data is available in Dashboard E.
A positive number for a gap indicates that the mean or median pay amount is higher for White staff than for staff from other ethnic groups.
| Year | Median % | Mean % |
| 2021 | -3.0 | 1.2 |
| 2021 | -4.5 | 7.7 |
| 2023 | -3.9 | 1.6 |
Median pay for BAME employees was higher than the median pay of White employees, as was the case in the two previous years. Mean pay for White employees was higher, but there was a reduction in the mean gap to 1.6% from 7.7% in 2022. This is reflected in a reduction of the proportion of BAME employees in the lowest quartile of hourly pay from 16% to 13% and an increase in the proportion of BAME employees in the highest quartile of hourly pay from 12% to 15%.
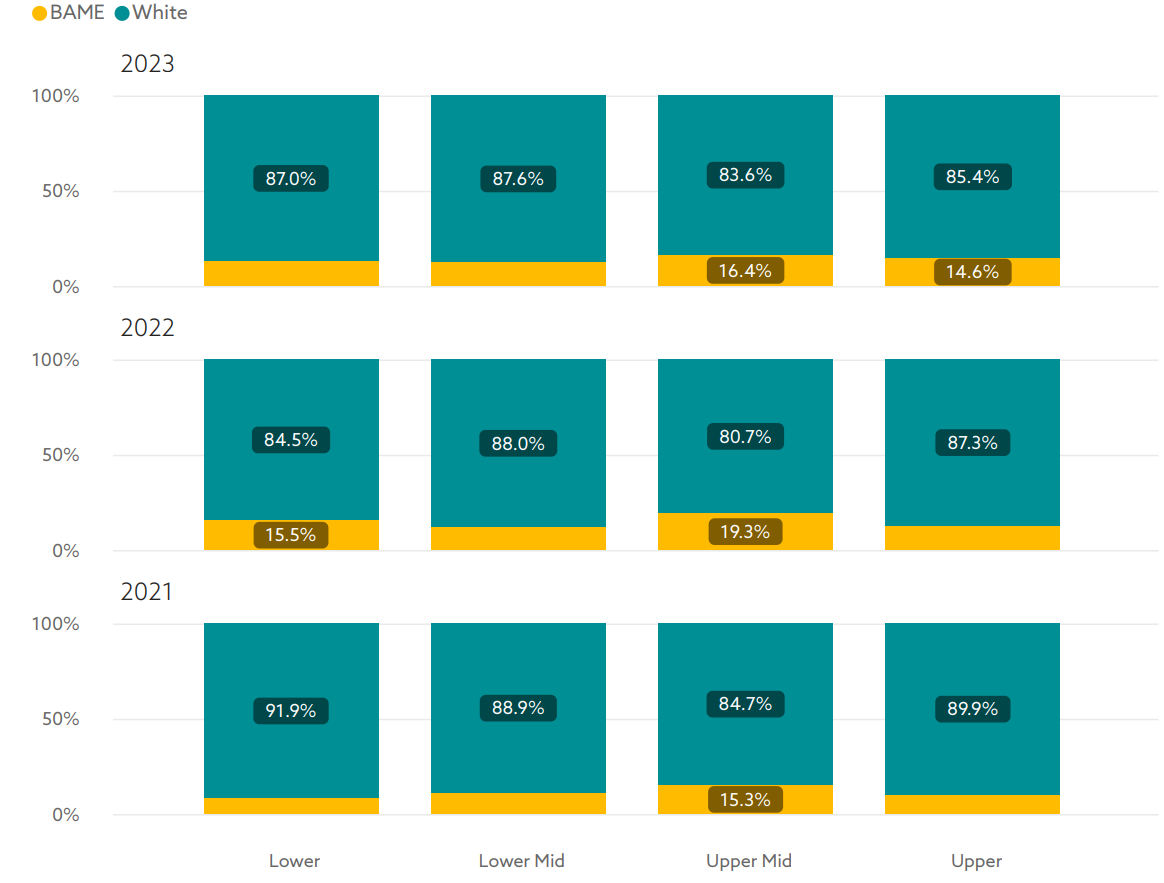
3. Ethnicity (two groups) Quartiles by Year, 2021 - 2023 (Full-pay equivalent employees, Northumbria University and Northumbria University Services Limited. Excludes 'Unknown' ethnicity, 'prefer not to say' or not recorded)
Despite an increase in employees from 317 in 2022 to 348, there was a small decrease in employees from a BAME background as a proportion of all full-pay relevant employees from 14.9% in 2022 to 14.1%. The reduction in the proportion of full-pay relevant employees from a BAME background between the 2022 and 2023 snapshot dates was 20.8% to 19.7% for Academic staff and from 9.5% to 9.1% for Professional Support staff.
The distribution of ethnicity by grade differs by employee type. For Academic roles, the proportion of full-pay relevant employees from BAME backgrounds increases from 19.1% at Grade 5 to 21.7% at Grade 7, then declines to 15.9% at Grade 8 and 13.7% at Grade 9. For Professional Support roles, the proportion of full-pay relevant employees from BAME backgrounds is 11.9% at Grade 4, declining to 2.2% at Grade 7. There are no full-pay relevant employees from BAME backgrounds at Professional Support Grades 8 to 10.
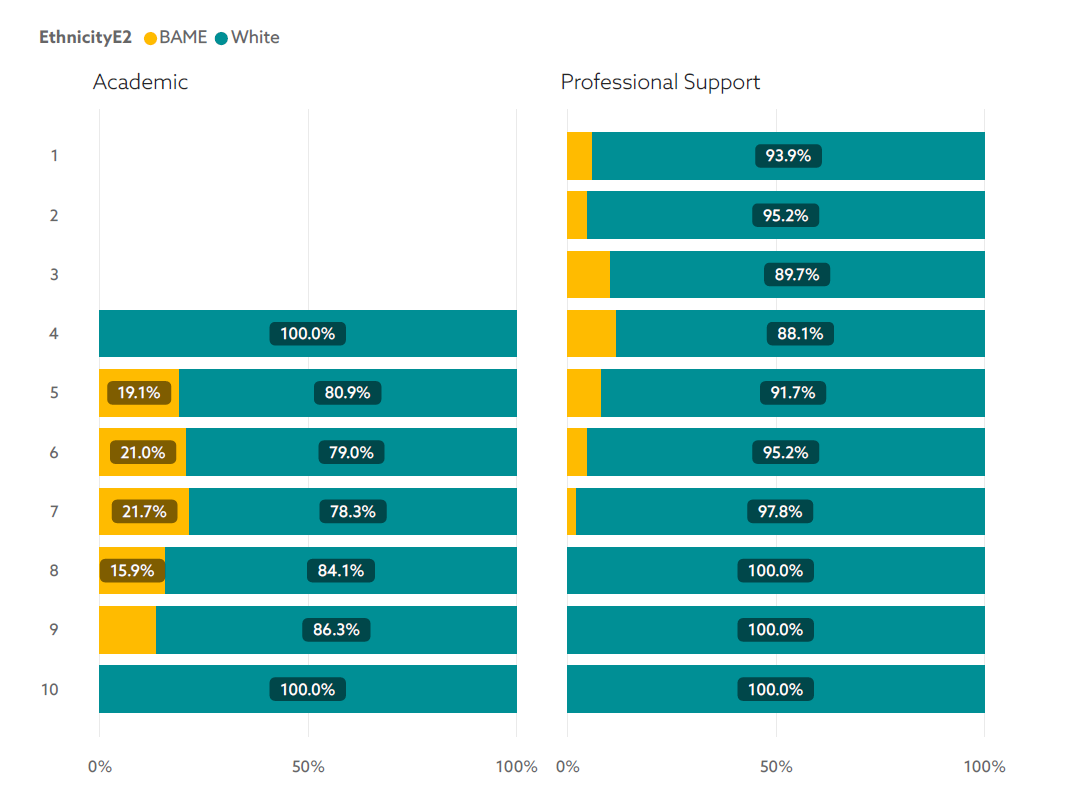
4. Ethnicity (two groups) by Grade and Employee Type, 2023 (Full-pay equivalent employees, Northumbria University and Northumbria University Services Limited. Includes Grades 1 - 10, excluding KTPs and other grades outside of main pay spine. Excludes 'Unknown' ethnicity, 'prefer not to say' or not recorded)
The five group model of ethnicity considers people of Asian, Black, Mixed ethnicities, and ethnicities other than Asian, Black, Mixed ethnicity or White backgrounds. As White is the group being used for comparison, White is not shown in the tables.
| Year | Asian | Black | Mixed | Other |
|
2021 |
-7.3 | 0.00 | 7.4 | -11.9 |
| 2022 | -8.2 | -4.0 | 5.4 | -4.0 |
| 2023 | -6.9 | -2.8 | 3.8 | -3.9 |
| Year | Asian | Black | Mixed | Other |
| 2021 | -0.4 | 1.1 | 13.8 | -4.2 |
| 2022 | 5.9 | 15.3 | 12.1 | 5.1 |
| 2023 | -0.9 | 7.8 | 7.0 | 1.0 |
There is greater year on year variation in the median and mean Ethnicity Pay Gaps compared to the Gender Pay Gap, especially when considered as five groups. This is mostly because the number of employees in each of the four groups other than White is lower. For example, in 2023, 49 full-pay relevant employees were Black and 817 full-pay relevant employees were women.

5. Ethnicity (five groups) Quartiles by Year, 2021 - 2023 (Full-pay equivalent employees, Northumbria University and Northumbria University Services Limited. Excludes 'Unknown' ethnicity, 'prefer not to say' or not recorded)

6. Ethnicity (five groups) by Grade and Employee Type, 2023 (Full-pay equivalent employees, Northumbria University and Northumbria University Services Limited. Includes Grades 1 - 10, excluding KTPs and other grades outside the main pay spine. Excludes 'Unknown' ethnicity, 'prefer not to say' or not recorded).
The five-group model of ethnicity shows that median pay for Asian employees is higher than median pay for White employees and has been since 2021. Median pay for Black employees has been higher than the median pay for White employees since 2022. There are more Asian employees than any other ethnicity group, other than White, meaning that average pay for Asian employees has a greater influence than the average pay of employees in the Black, Mixed or Other ethnicity groups on the two group pay gap measures. The median pay gap for all four ethnic groups has narrowed (moved closer to zero) compared to White employees, meaning that it has decreased for employees of Mixed ethnicity and increased for the three other groups.
Back to top
