
Select the relevant link below to navigate to a specific desired section or continue reading the full content:
- Workforce Composition
- Recruitment
- Leavers
- Starters' and Leavers' Survey
- Northumbria in Comparison to Region and Sector
Census date: 31 March 2025
This narrative focuses on material year‑on‑year changes. Efforts to encourage self‑disclosure of protected characteristics through NUPF have resulted in significant increases in disclosure. Year‑on‑year reductions in ‘Not known’ are highlighted throughout. ‘Not known’ (indicating no self‑disclosure) and ‘Prefer not to say’ are reported separately.
Executive Summary
- Total workforce headcount at 31 March 2025: 3,422 (down 129, -3.6% vs 2024).
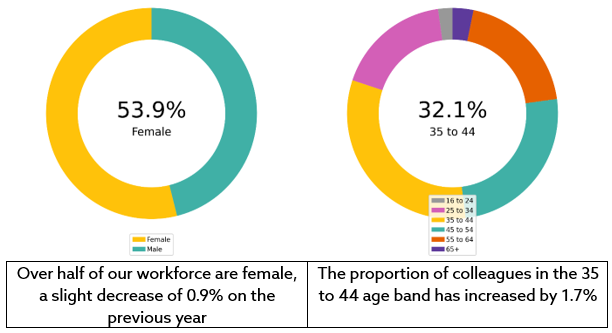
- Sex: Female representation 53.9% (−0.9 percentage points vs 2024).
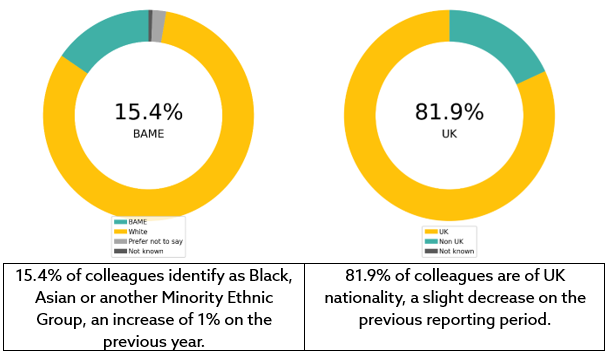
- Ethnicity: BAME representation 15.4% (+1.0 pp); ‘Not known’ down from 2.8% to 0.6%.
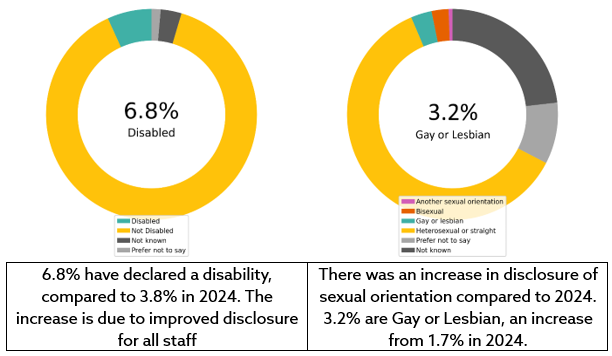
- Disability: Disabled 6.8% (+3.0 pp); ‘Not known’ down from 13.6% to 3.2%.
- Gender identity, sexual orientation, and religion all show large falls in ‘Not known’, reflecting improved disclosure.
- Starters 250 (139 Academic; 111 Professional Support).
- Leavers 587 (215 Academic; 372 Professional Support).
Workforce Composition
Disclosure and data quality (NUPF)
Targeted activity through NUPF to encourage self‑disclosure has materially reduced ‘Not known’ across protected characteristics: Ethnicity (from 2.8% to 0.6%), Disability (13.6% to 3.2%), Gender identity (66.2% to 23.0%), Sexual orientation (67.9% to 23.2%), and Religion (54.3% to 24.5%). This step‑change enhances the reliability of trend analysis and enables more precise EDI action planning.
Notes
- Reporting window for starters and leavers: 1 April 2024 to 31 March 2025.
- Headcounts are whole numbers; percentages are shown to one decimal place.
- ‘Not known’ indicates no self‑disclosure; ‘Prefer not to say’ indicates a conscious choice not to disclose.
- The disclosure rates are correct as of 12 June 2025.
Academic/Professional Support Split
| Employee Type | Headcount | Headcount % | FTE | FTE % |
| Academic | 1686 | 49.3 | 1600.8 | 51.4 |
| Professional Support | 1736 | 50.7 | 1516.3 | 48.6 |
| Total | 3422 | 100 | 3117.1 | 100 |
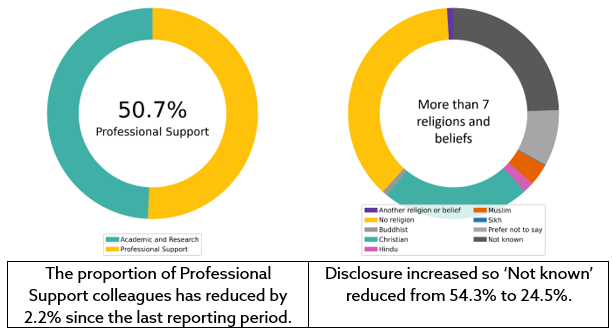
Headcount was 3,422 at 31 March 2025 compared with 3,551 on 31/03/2024 (−129; −3.6%). Academic and Research comprised 1,686 (49.3%) and Professional Support 1,736 (50.7%). Compared with 2024, Academic grew slightly (from 1,673) while Professional Support declined (from 1,878).
Age
| Age Band | Headcount | Headcount % | FTE | FTE % |
| 16 to 24 | 75 | 2.2 | 64.2 | 2.1 |
| 25 to 34 | 605 | 17.7 | 571.9 | 18.3 |
| 35 to 44 | 1098 | 32.1 | 1024.9 | 32.9 |
| 45 to 54 | 864 | 25.2 | 810.1 | 26 |
| 55 to 64 | 671 | 19.6 | 574.3 | 18.4 |
| 65+ | 109 | 3.2 | 71.8 | 2.3 |
| Total | 3422 | 100 | 3117.1 | 100 |
Sex
| Gender | Headcount | Headcount % | FTE | FTE % |
| Female | 1844 | 53.9 | 1617.3 | 51.9 |
| Male | 1578 | 46.1 | 1499.8 | 48.1 |
| Total | 3422 | 100 | 3117.1 | 100 |
Female representation was 53.9% (1,844) and male 46.1% (1,578), compared with 54.8% and 45.2% in 2024. This is a modest shift (−0.9 percentage points for females) within the context of a smaller workforce.
Ethnicity
| Ethnicity | Headcount | Headcount % | FTE | FTE% |
| BAME | 527 | 15.4 | 495.7 | 15.9 |
| White | 2800 | 81.8 | 2539.9 | 81.5 |
| Prefer not to say | 73 | 2.1 | 69.2 | 2.2 |
| Not Known | 22 | 0.6 | 12.4 | 0.4 |
| Total | 3422 | 100 | 3117.1 | 100 |
BAME representation increased to 15.4% (from 14.4%), while White decreased to 81.8% (from 82.8%).
Disability
| Disability | Headcount | Headcount % | FTE | FTE % |
| Disabled | 232 | 6.8 | 212.8 | 6.8 |
| Not Disabled | 3034 | 88.7 | 2770 | 88.9 |
| Not known | 108 | 3.2 | 90.9 | 2.9 |
| Prefer not to say | 48 | 1.4 | 43.4 | 1.4 |
| Total | 3422 | 100 | 3117.1 | 100 |
Disabled representation rose to 6.8% (from 3.8% in 2024). ‘Prefer not to say’ was 1.4%. The most material change was a drop in ‘Not known’ to 3.2% (from 13.6%), a direct benefit of improved self‑disclosure.
Nationality
| Nationality | Headcount | Headcount % | FTE | FTE % |
| UK | 2803 | 81.9 | 2518.8 | 80.8 |
| Non UK | 619 | 18.1 | 598.4 | 19.2 |
| Not known | 0 | 0 | 0 | 0 |
| Total | 3422 | 100 | 3117.1 | 100 |
The profile remained broadly stable: UK 81.6% (−1.0 pp), EU 6.4% (flat), Europe (non‑EU) 0.7% (+0.4 pp), International 11.0% (+0.3 pp), with ‘Not known’ at 0.3%. No material risks identified.
Gender Identity
| Gender Identity | Headcount | Headcount % | FTE | FTE % |
| Woman | 1371 | 40.1 | 1247 | 40 |
| Man | 1082 | 31.6 | 1036.8 | 33.3 |
| Non-binary | 16 | 0.5 | 15 | 0.5 |
| In another way | 11 | 0.3 | 9.8 | 0.3 |
| Prefer not to say | 154 | 4.5 | 146 | 4.7 |
| Not known | 788 | 23 | 662.5 | 21.3 |
| Total | 3422 | 100 | 3117.1 | 100 |
The largest single disclosure improvement: ‘Not known’ fell to 23.0% (from 66.2%). Disclosed categories increased accordingly (women 40.1%, men 31.6%, non‑binary 0.5%, ‘in another way’ 0.3%, ‘prefer not to say’ 4.5%). The shift significantly strengthens insight into gender identity across staff groups.
Sexual Orientation
| Sexual Orientation | Headcount | Headcount % | FTE | FTE % |
| Another sexual orientation | 20 | 0.6 | 19.3 | 0.6 |
| Bisexual | 88 | 2.6 | 81.6 | 2.6 |
| Gay or lesbian | 110 | 3.2 | 106.3 | 3.4 |
| Heterosexual or straight | 2086 | 61 | 1939.9 | 62.2 |
| Prefer not to say | 323 | 9.4 | 304 | 9.8 |
| Not known | 795 | 23.2 | 666 | 21.4 |
| Total | 3422 | 100 | 3117.1 | 100 |
‘Not known’ fell markedly from 67.9% to 23.2%. ‘Heterosexual/straight’ increased to 61.0% (from 28.6%), with increases also in gay/lesbian (3.2%), bisexual (2.6%) and ‘another orientation’ (0.6%). Changes reflect enhanced disclosure rather than demographic shifts.
Religion
| Religion | Headcount | Headcount % | FTE | FTE % |
| Another religion or belief | 34 | 1 | 29.8 | 1 |
| No religion | 1276 | 37.3 | 1187.3 | 38.1 |
| Buddhist | 27 | 0.8 | 26.4 | 0.8 |
| Christian | 778 | 22.7 | 724.3 | 23.2 |
| Hindu | 54 | 1.6 | 53 | 1.7 |
| Muslim | 116 | 3.4 | 107.6 | 3.5 |
| Sikh | 5 | 0.1 | 5 | 0.2 |
| Prefer not to say | 294 | 8.6 | 277.4 | 8.9 |
| Not known | 838 | 24.5 | 706.3 | 22.7 |
| Total | 3422 | 100 | 3111.7 | 100 |
‘Not known’ reduced from 54.3% to 24.5%. The largest disclosed groups were ‘No religion’ (37.3%) and ‘Christian’ (22.7%), with smaller proportions identifying as Muslim (3.4%), Hindu (1.6%), Buddhist (0.8%) and Sikh (0.1%). ‘Prefer not to say’ accounted for 8.6%.
Recruitment
Starters
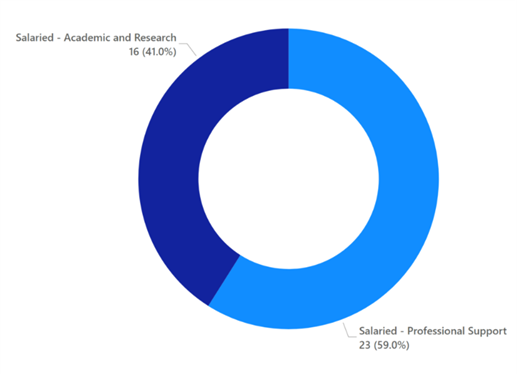
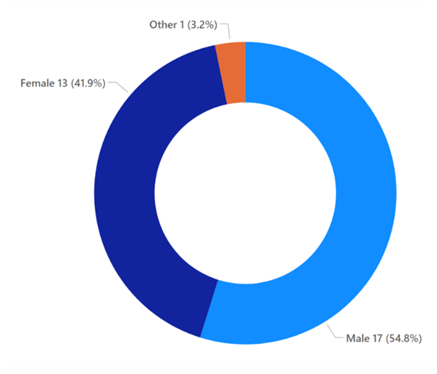
There were 250 starters (down from 297 in 2024): 139 Academic and Research; 111 Professional Support. Among Academic starters, 58.3% were female. Among Professional Support starters, 53.2% were female. Professional Support starters were 24.3% BAME, with ‘Not known’ at 6.3% for ethnicity and 12.6% for disability. These patterns are consistent with improved data capture at onboarding.
Recruitment (Academic)
Gender
| Gender | Headcount | Headcount % | FTE | FTE % |
| Female | 81 | 58.3 | 74.7 | 57.9 |
| Male | 58 | 41.7 | 54.3 | 42.1 |
| Total | 139 | 100 | 129.1 | 100 |
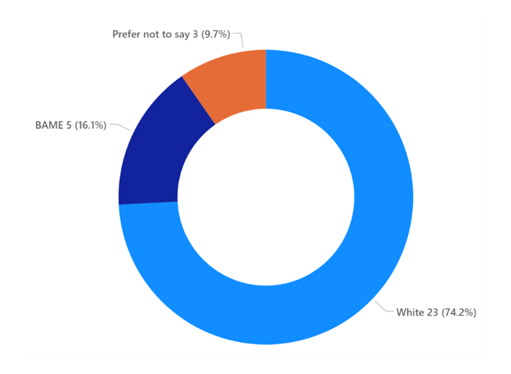
Ethnicity
| Ethnicity | Headcount | Headcount % | FTE | FTE % |
| BAME | 57 | 41 | 53.9 | 41.8 |
| White | 77 | 55.4 | 71.4 | 55.3 |
| Not known | 2 | 1.4 | 0.7 | 0.5 |
| Prefer not to say | 3 | 2.2 | 3 | 2.3 |
| Total | 139 | 100 | 129.1 | 100 |
Disability
| Disability | Headcount | Headcount % | FTE | FTE % |
| Disabled | 17 | 12.2 | 15.2 | 11.8 |
| Not disabled | 111 | 79.9 | 104.3 | 80.9 |
| Not known | 6 | 4.3 | 5.3 | 4.1 |
| Prefer not to say | 5 | 3.6 | 4.2 | 3.3 |
| Total | 139 | 100 | 129.1 | 100 |
Recruitment (Professional Support)
Gender
| Gender | Headcount | Headcount % | FTE | FTE % |
| Female | 59 | 53.2 | 47.5 | 52.3 |
| Male | 52 | 46.8 | 43.4 | 47.7 |
| Total | 111 | 100 | 90.9 | 100 |
Ethnicity
| Ethnicity | Headcount | Headcount % | FTE | FTE % |
| BAME | 27 | 24.3 | 21.2 | 23.3 |
| White | 77 | 69.4 | 67.2 | 73.9 |
| Not known | 7 | 6.3 | 2.5 | 2.7 |
| Prefer not to say | 0 | 0 | 0 | 0 |
| Total | 111 | 100 | 90.9 | 100 |
Disability
| Disability | Headcount | Headcount % | FTE | FTE % |
| Disabled | 9 | 8.1 | 6.8 | 7.5 |
| Not disabled | 87 | 78.4 | 73.6 | 81 |
| Not known | 14 | 12.6 | 9.5 | 10.4 |
| Prefer not to say | 1 | 0.9 | 1 | 1.1 |
| Total | 111 | 100 | 90.9 | 100 |
Leavers
There were 587 leavers (up from 483 in 2024): 215 Academic and Research; 372 Professional Support. Across all leavers where sex was recorded, 60.5% were female. We will continue to monitor leaver trends by staff group and protected characteristics as disclosure rates improve.
Leavers (Academic)
Gender
| Gender | Headcount | Headcount % | FTE | FTE % |
| Female | 113 |
52.6 |
97.5 | 51.9 |
| Male | 101 | 47 | 89.5 | 47.6 |
| Other | 1 | 0.5 | 1 | 0.5 |
| Total | 215 | 100 | 188 | 100 |
Ethnicity
| Ethnicity | Headcount | Headcount % | FTE | FTE % |
| BAME | 58 | 27 | 54.5 | 29 |
| White | 150 | 69.8 | 127.3 | 67.7 |
| Not known | 2 | 0.9 | 1.2 | 0.6 |
| Prefer not to say | 5 | 2.3 | 5 | 2.7 |
| Total | 215 | 100 | 188 | 100 |
Disability
| Disability | Headcount | Headcount % | FTE | FTE % |
| Disabled | 9 | 4.2 | 7.9 | 4.2 |
| Not disabled | 197 | 91.6 | 174.1 | 92.6 |
| Not known | 8 | 3.7 | 5 | 2.7 |
| Prefer not to say | 1 | 0.5 | 1 | 0.5 |
| Total | 215 | 100 | 188 | 100 |
Leavers (Professional Support)
Gender
| Gender | Headcount | Headcount % | FTE | FTE % |
| Female | 225 | 60.5 | 117.9 | 57.2 |
| Male | 147 | 39.5 | 133 | 42.8 |
| Total | 372 | 100 | 310.9 | 100 |
Ethnicity
| Ethnicity | Headcount | Headcount % | FTE | FTE % |
| BAME | 68 | 18.3 | 54.3 | 17.5 |
| White | 293 | 78.8 | 247.1 | 79.5 |
| Not known | 5 | 1.3 | 4.5 | 1.5 |
| Prefer not to say | 6 | 1.6 | 4.9 | 1.5 |
| Total | 372 | 100 | 310.9 | 100 |
Disability
| Disability | Headcount | Headcount % | FTE | FTE % |
| Disabled | 17 | 4.6 | 14.5 | 4.7 |
| Not disabled | 318 | 85.5 | 263.3 | 84.7 |
| Not known | 33 | 8.9 | 29.6 | 9.5 |
| Prefer not to say | 4 | 1.1 | 3.5 | 1.1 |
| Total | 372 | 100 | 310.9 | 100 |
Starters' and Leavers' Survey
The starters and leavers surveys were redeveloped in November 2024 to improve insights and trend analysis. This report covers the five-month period from the launch of these new survey designs to 31st March 2025. Population refers to the number of salaried employees who joined or left the University between 1st November 2024 and 31st March 2025.
| Survey | Population | Responses | Response Rate |
| Starters | 86 | 39 | 45.3% |
| Leavers | 165 | 31 | 18.8% |
For the starters’ survey, positive responses (agree or strongly agree) included:
| Statement | Agreement |
| My line manager provided support to help me integrate | 100% |
| My line manager was welcoming | 100% |
| My colleagues provided adequate support to help me integrate | 97.4% |
| I received adequate information to do my work | 88.9% |
| On my first day I had everything that I needed to start working | 79.4% |
For the leavers’ survey, positive responses (agree or strongly agree) included:
| Statement | Agreement |
| I had good working relationships with my colleagues | 96.3% |
| I was treated with fairness and respect | 86.2% |
| I felt a sense of belonging | 82.1% |
| The culture at Northumbria is positive | 80% |
| I felt supported to develop my career here | 57.5% |
No significant differences were identifiable between male and female respondents, or between respondents of different ethnicities.
Starters' Survey
Employee Type
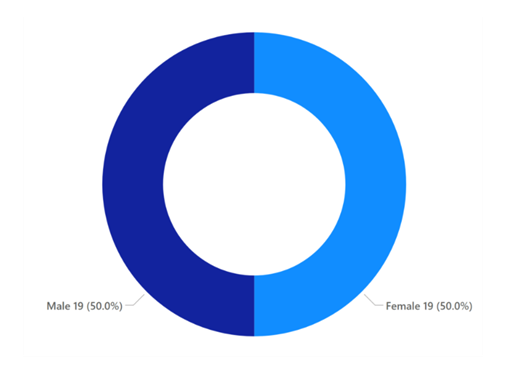
Gender
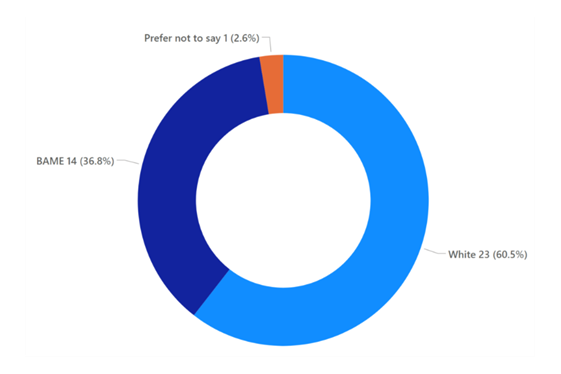
Ethnicity
Leavers' Survey
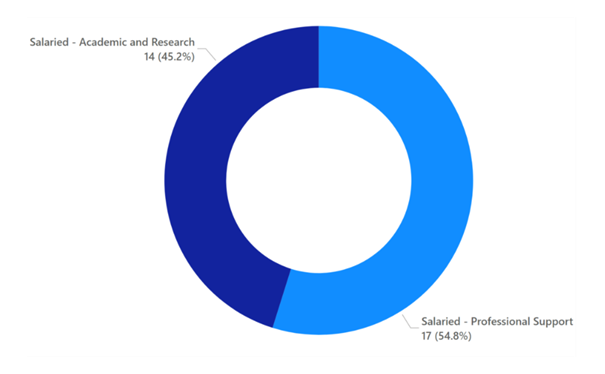
Employee Type
Gender
Ethnicity
Northumbria in Comparison to Region and Sector
This section uses the most recently available Higher Education Statistics Agency (HESA) data with a census date of 31 July 2024 (academic year 2023/24) to benchmark Northumbria University against the region and the wider sector.
Northumbria’s internal figures used for comparison are as of 31 March 2025. Because the census points differ and HESA definitions may vary slightly from internal reporting, these benchmarks should be considered indicative rather than exact. The regional Universities referred to are Newcastle, Durham, Sunderland and Teesside.
Workforce Size
Newcastle University is the largest employer with 6,590 staff, followed by Durham University (6,000). Northumbria’s headcount at 31 March 2025 is 3,422, ahead of Sunderland (2,655) and Teesside (2,245).
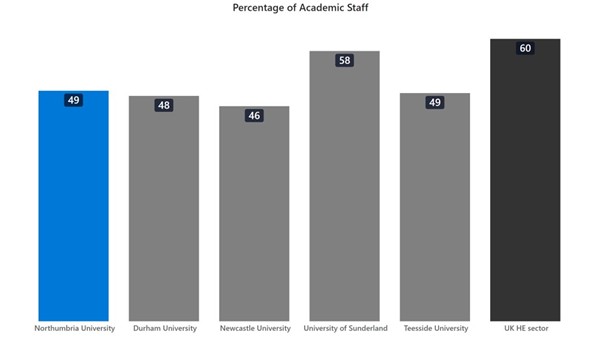
Academic and Professional Support
Academic staff as a proportion of total staff in North East universities ranges from 57.8% at Sunderland to 48.2% at Durham and 46.0% at Newcastle. Northumbria’s Academic and Research staff account for 49.3% of the workforce (with Professional Support at 50.7%).
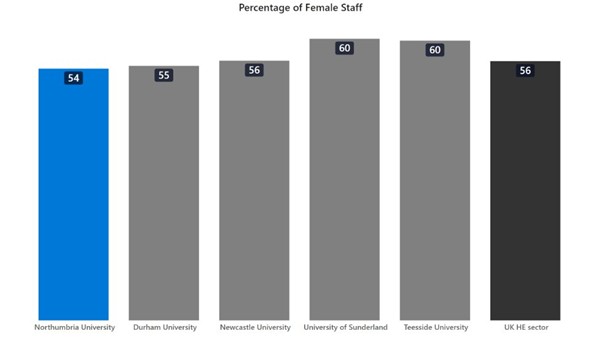
Sex
Female representation in the region is 56.2% overall: Newcastle 55.6%, Durham 54.5%, Northumbria 53.9%, Sunderland 60.3%, and Teesside 59.9%.
Ethnicity
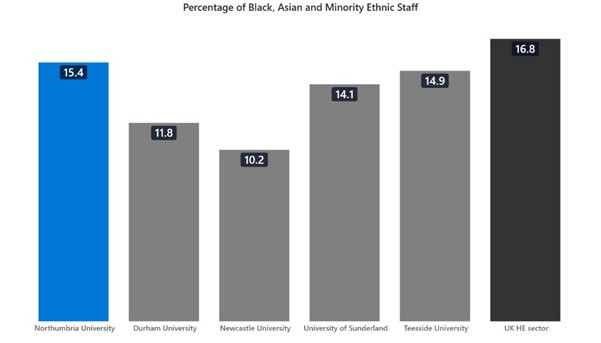
The proportion of Black, Asian and Minority Ethnic (BAME) staff in North East universities is 12.1% overall, below the UK sector average of 16.8%. By university: Newcastle 10.2% BAME, Durham 11.8%, Sunderland 14.1%, Teesside 14.9%. Northumbria’s profile is 15.4% BAME, greater than other North East universities, though slightly below the UK sector average.
Disability
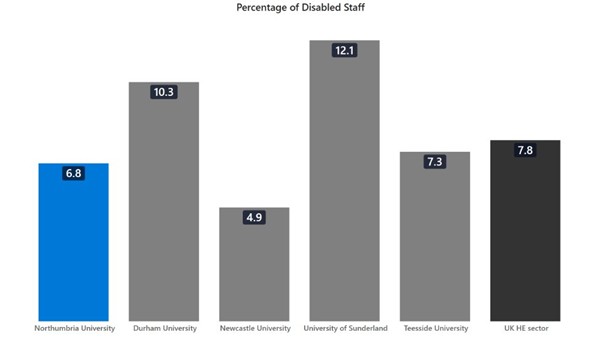
Across North East universities, 7.1% of staff are recorded as Disabled, compared with 7.8% across the UK sector. As of 31 April 2025 6.8% of Northumbria staff were Disabled, higher than Newcastle at 4.9% and close to the sector average, though below Durham, 10.3%, Sunderland, 12.1%, and Teesside, 7.3%.
Notes on Disclosure
Northumbria has continued to actively encourage self-disclosure of protected characteristics through NUPF, which helps to reduce ‘Not known’ responses internally. Where HESA figures for Northumbria appear lower, particularly for disability, this reflects the different census date and the impact of improved internal disclosure post-July 2024.
Latest News and Features
Northumbria University research unlocks the secrets of Vivienne Westwood's craft in a major new exhibition
A fashion researcher and educator from Northumbria University has created what is believed…
NESST topping out ceremony attendees receive traditional tankards to celebrate build milestone
Topping out ceremony marks pivotal moment for centre backed by £50 million investment set to…
From Netflix to Newcastle Northumbria graduate uses AI to revolutionise film and TV production
A Northumbria University graduate who co-created Bangkok Breaking — one of Thailand's biggest…
Northumbria University researcher brings death-positive arts festival to libraries across England
An arts festival exploring death, dying and end-of-life choices — led by a Northumbria University…
Northumbria University spinout achieves CE marking for deep lung breath sampling device — a first backed by peer-reviewed research
A medical device company spun out of Northumbria University has reached a significant milestone…
Northumbria University's IT recycling initiative recognised as national best practice
The equivalent weight of one and a half double-decker buses' worth of IT equipment has been…
Scientists solve decades-long mystery about why Saturn appears to change its spin
Researchers at Northumbria University have used the most powerful space telescope ever built…
Northumbria University professor named among UK's most outstanding health and care research leaders
A Northumbria University professor has been appointed as one of the UK's most influential health…
More events
Upcoming events

From sustenance to complete nourishment in a changing and uncertain climate
Ellison Building A, 001 (ELA 001)
-

Broken Bonds: New Perspectives on Marital Breakdown
The Great Hall
-

Smarter Supply Chains: Digital Innovation for Cost, Efficiency & Carbon
Northumbria University
-

Culture in Conversation: Rethinking Leadership & Organisational Practice
CCE1 Newcastle Business School
-
