In an article written for The Conversation*, Andrew Suggitt, Assistant Professor in Geography and Environmental Sciences at Northumbria University, and Alistair Auffret, Senior Lecturer in Landscape Ecology at the Swedish University of Agricultural Sciences, discuss how making a new map of land-use change for Great Britain helped their research into the extinction crisis.
Under the stewardship of geographer Sir Dudley Stamp, thousands of volunteers (including many schoolchildren) came together in the 1930s on a mission that sounds relatively simple on paper: to record how British land was being used.
Equipped with an Ordnance Survey map, a clipboard and a pencil, these volunteers recorded information that collectively formed the earliest spatial record of where and how the British people were using their environment at the beginning of the third agricultural revolution. Spanning the mid-20th century, that revolution changed the British landscape almost beyond recognition.
The landscape changed largely because it had to. More land was brought into production to feed a growing post-war population. This involved converting semi-natural habitats to cropland, removing hedgerows and enhancing pastures with fertilisers and faster-growing fodder (creating agriculturally “improved” grassland). More homes were also built to provide a better quality of life.
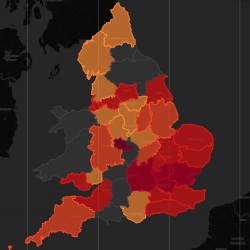
In our new study, we digitally converted scanned copies of the Dudley Stamp maps and compared them with modern-day satellite data to record the full extent of land-use change across Britain in the mid-20th century. Our change map outlines the level of land conversion for every 10km x 10km grid square of Britain.
Mapping land-use change in Britain
We estimate that roughly 90% of lowland meadow and pasture has been lost. Land was converted either to arable farmland, which saw a 22% increase, or to agriculturally improved grassland, which now occupies 27% of Britain’s land area.
Urbanisation saw the nation’s built area expand from 4% to 5%. And woodland cover doubled from 6% to 12%, largely due to a concerted effort to increase the country’s reserve of timber. For better or worse, the nation’s land use became less mixed and more consolidated.
All of this environmental change is thought to have had a profound effect on biodiversity. According to the recent State of Nature Report, the abundance of UK species has declined by an average of 19% since 1970. Some 1,500 species (or 16% of those analysed) are now threatened with national extinction.
The impacts of climate change on biodiversity are also becoming ever more apparent in almost all the Earth’s ecosystems and at all levels of biological organisation – from genes right up to ecosystems. There is no doubt that increasing human activity is posing a greater series of challenges for the natural world in this new geological epoch we term “the Anthropocene”.
What’s driving biodiversity change?
Although evidence documenting widespread changes to biodiversity is now relatively easy to come by, attributing these changes to a particular driver, or series of drivers, continues to prove quite difficult. This is because we know relatively little about how these drivers can “interact” with one another to make things worse.
But the net effect of drivers acting in concert can be quite different to the individual effect of each driver acting alone. For example, research has demonstrated that climate change is more likely to lower insect diversity in agricultural landscapes compared to more natural systems.
Disentangling the different drivers of biodiversity change has proved particularly problematic in the UK. The intensification of agriculture and the other changes in land use of the mid-20th century occurred before Earth observation satellites were in orbit. Many habitats were lost before we could document the true scale of the change and, just as importantly, which regions, landscapes and locations were most affected.
Climate and land-use change acting together
Making our new land-use change map for Britain meant that we could now finally investigate the extent to which this change combined with climate change to worsen the prognosis for the country’s flora and fauna.
Our investigation determined that these drivers did not often interact. In fact, less than one in five of the species we studied were affected by change drivers acting to accelerate or dampen one other. And their combined effect on extinction risk was often mild.
For roughly three-quarters of the species that responded to environmental change (668 of 898 species), we found that climate warming and land conversion acted independently of one other. This means that for species like the small pearl-bordered fritillary butterfly (Boloria selene), which predominantly inhabits cooler and wetter habitats, the impacts of warming temperatures and habitat loss, while detrimental, have not exacerbated each other to increase the chance of the butterfly’s populations dying out.
Many species were only affected by one of the change drivers we analysed, and not both. We found that globeflower (Trollius europaeus), for example, has declined due to habitat loss alone.
Because our results were less complicated than we expected, the so-called “winners” and “losers” of environmental change among British flora and fauna might be easier to predict than we anticipated. However, the highly individual responses to change we detected – and the wide split between winners and losers associated with these responses – mean it is difficult to come up with rules of thumb for conservationists, authorities or land managers to use when taking action on the extinction crisis.
As such, we need to maintain our emphasis on the inclusion of species-level information when devising plans to maintain biodiversity. We also need to continue supporting biological recording efforts, as these often act as the barometer by which we can judge if conservation measures are successful.
We hope that our study is the first of many to make full use of the valuable information collected by Dudley Stamp and his volunteer army almost 100 years ago. Digital versions of our maps are publicly available for free download so that researchers, conservationists and the general public can see where Britain’s landscape has changed the most.
*This article was originally published by The Conversation. Please see here for republishing guidelines.